

![30th Sep: What's Your Number? (2011), 1hr 46m [R] (6/10)](https://occ-0-7328-1001.1.nflxso.net/dnm/api/v6/0Qzqdxw-HG1AiOKLWWPsFOUDA2E/AAAABfwbLQecWQQv33za9OPmTMM94hYi7QtP2Ehf18Rv1oNfX0L4tbQDlvcUNgejxMEWObOFCvKt6N6X0wzTrCu6ckd0uAoLI6SII67b.jpg?r=da3 "30th Sep: What's Your Number? (2011), 1hr 46m [R] (6/10)")



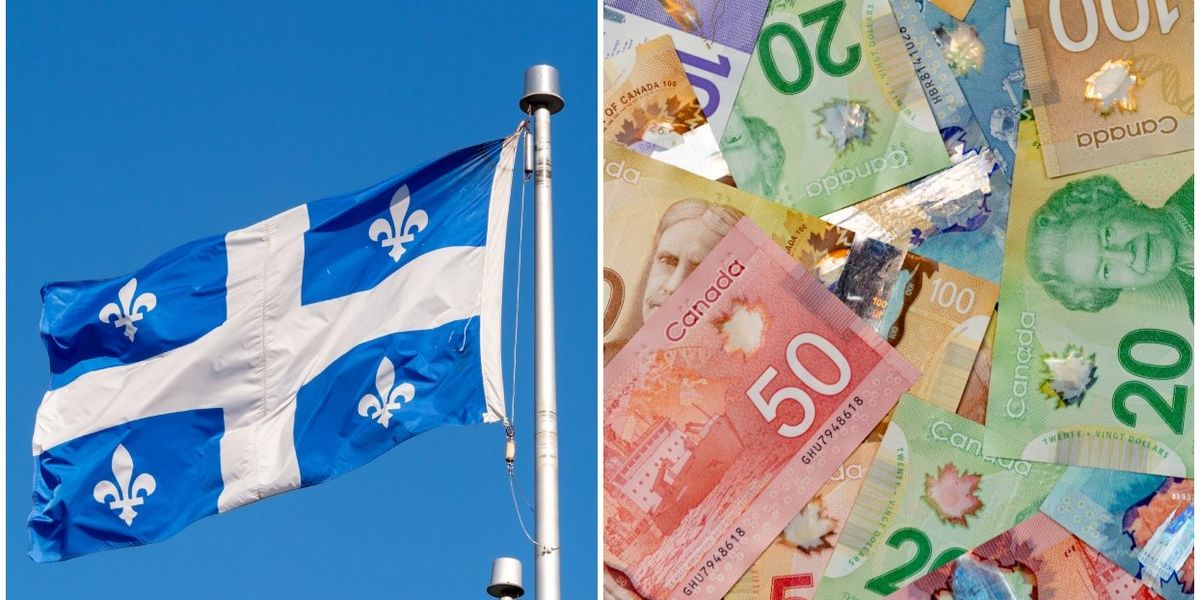


Wages across Canada have been climbing steadily this year, and Quebec is seeing some of that growth too, just not quite as much as everyone else.
According to Statistics Canada’s latest Employment, Payroll Employment, Earnings and Hours report, released September 24 and covering data through July 2026, the average weekly salary across the country reached $1,347.14, up 3.2% compared to the same month last year. Annualized over 52 weeks, that works out to roughly $70,051 a year.
In Quebec, the average weekly wage came in at $1,279.96 for July, a slight dip from June but still up 1.9% compared to a year earlier. That comes out to about $66,558 per year.
How Quebec salaries compare to the rest of the country
The territories dominate the top of the list, thanks to smaller job markets and unique working conditions. Among the provinces, Quebec sits closer to the middle of the pack.
Here’s how average weekly earnings broke down by province and territory in July 2026:
- Nunavut: $1,844.70/week | +2.3% | $95,924/year
- Northwest Territories: $1,821.38/week | +4.8% | $94,712/year
- Yukon: $1,504.26/week | +1.1% | $78,222/year
- Alberta: $1,399.61/week | +2.5% | $72,780/year
- Ontario: $1,391.19/week | +3.6% | $72,342/year
- British Columbia: $1,356.78/week | +4.4% | $70,553/year
- Saskatchewan: $1,325.24/week | +4.4% | $68,912/year
- Newfoundland and Labrador: $1,317.98/week | +1.7% | $68,535/year
- Quebec: $1,279.96/week | +1.9% | $66,558/year
- New Brunswick: $1,261.88/week | +5.3% | $65,618/year
- Nova Scotia: $1,228.91/week | +5.6% | $63,903/year
- Manitoba: $1,217.11/week | +3.1% | $63,290/year
- Prince Edward Island: $1,207.99/week | +4.1% | $62,815/year
That puts Quebec ninth out of thirteen. Both Nova Scotia and New Brunswick still pay less on average than Quebec, but they’re growing faster, at 5.6% and 5.3%.
Meanwhile, Quebec’s minimum wage sits at $16.60 an hour, close to Manitoba and New Brunswick, and ahead of Alberta’s $15.00.
Why average wages are going up
A rising average wage doesn’t mean everyone got a raise. Statistics Canada attributes the shift to a mix of factors, including which industries are hiring, how many hours people are working, and base-year effects baked into the year-over-year comparison.
In July, payroll employment grew in 8 of the 20 sectors Statistics Canada tracks. The biggest gains came from:
- Retail trade: +3,900 jobs
- Accommodation and food services: +3,600 jobs
- Professional, scientific and technical services: +2,500 jobs
- Real estate and rental and leasing: +2,300 jobs
Those gains were partly offset elsewhere. Public administration lost 5,700 jobs, largely tied to the winding down of temporary Census 2026 staffing, and wholesale trade dropped another 4,100 positions.
Even so, the country added a net 26,100 jobs in July, following 124,200 added between March and June. Over the past year, payroll employment is up 171,900 jobs, or 0.9%.
Full details are available through Statistics Canada’s report.
AI tools may have been used to support the creation or distribution of this content; however, it has been carefully edited and fact-checked by a member of MTL Blog’s Editorial team. For more information on our use of AI, please visit our Editorial Standards page.